If you are developing a complex website whose users will come to it to carry out complex tasks then you’re likely to want to use a range of data to support your decision-making. This was the situation when I was helping the Open University develop the website used by enquirers to decide whether to sign up for a course of study. And it made an interesting case study for the first international conference on Human Centred Design – HCD 2009 – held in San Diego in July. This paper was co-authored with Whitney Quesenbery, and the OU’s Ian Roddis, Sarah Allen and Viki Stirling.
Introduction
The Open University is the UK’s largest university and the only one dedicated solely to distance learning. Its 220,000 students include more than 40,000 who are studying from outside the UK. Its online prospectus “Study at the OU” is a key tool in attracting and retaining students, and is also important as the sole route to online course registrations: more than £100 million (equivalent to US$150 million) of online registrations are taken each year.
The usability of the University’s online prospectus is clearly important to the University, and has been the subject of user research and usability studies for several years now, for example [1].
The overall responsibility for development of the Open University’s web presence is led by Ian Roddis, Head of Online Services in the Communications team. He co-ordinates the efforts of stakeholder groups, including developers, usability consultants, the academics, and many others.
The team is committed to user-centred design, both by involving users directly in usability tests, participatory design sessions and other research, and indirectly through a variety of different data sets, including search logs and web tracking.
In this paper, we describe three examples of the way we use measurement to inform development:
- Triangulating between web analytics, search logs and usability testing
- Drawing on data from web analytics and search logs to inform our choices of what to measure in summative testing
- Using search logs to establish whether a new feature is important for usability.
Triangulating between web analytics, search logs and usability testing
There’s long been discussion in the usability community about the ‘right’ number of participants for a usability test; to give just three of the contributions to the arguments, there is the claim that five users is enough [3], the rejoinders that five users are nowhere near enough [4], and discussion of the mathematics that can help you to discern how many users you need [5].
We prefer to think in terms of iteration between usability testing, typically with five to 12 users, and the use of other data sources – a view supported by Lewis [6].
Each of these methods informs the others, providing direction about possible usability problems and design solutions. In addition, when we see consistent insights from both analytics and qualitative evaluations we have greater confidence in the results of both methods.
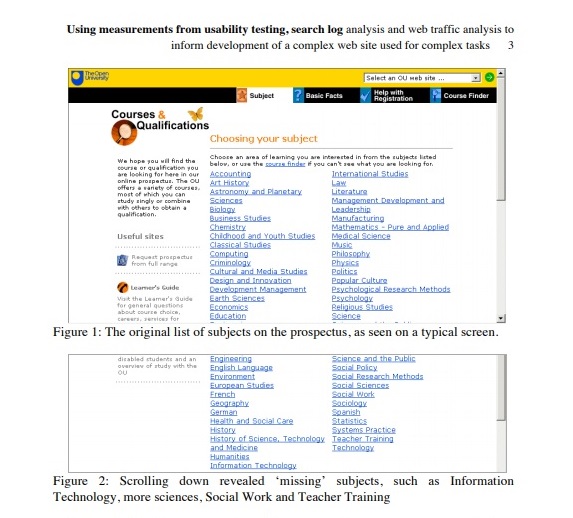
For example, in one round of usability testing on the prospectus we noticed a problem. Users found it difficult to work with the list of subjects:
- The list was quite long (50 subjects)
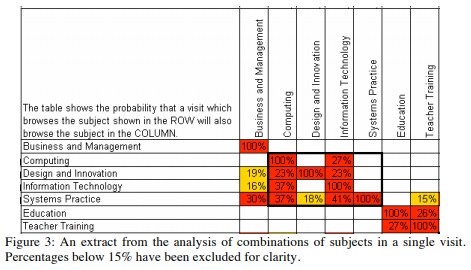
- When viewed on a typical screen at that time, some of the list was ‘below the fold’ and not visible to the user
- The list was presented in alphabetical order, which meant that some related subjects (e.g. Computing and Information Technology) were separated from each other.
 We could have done more testing with more participants to measure exactly how much of a problem this was, but instead we opted to note that it was a problem and to look for ways to understand the behaviour in more depth. We decided to use web analytics to look at the relative numbers of visits to the different subjects, and the likelihood that a visitor would combine exploration of two different subjects in a single visit.
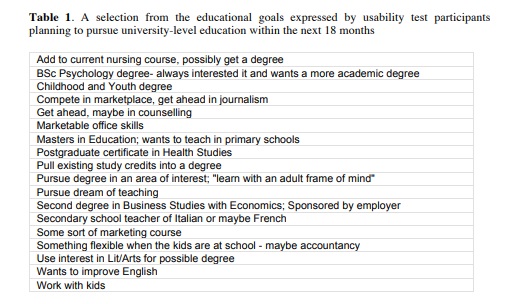
For example, in Figure 3 we see that 37% of visits that involved Information Technology also involved Computing, but that only 27% of visits that involved Computing also involved Information Technology. In addition, we found that Computing was receiving 33% more visitors than Information Technology. This was likely caused by the user interface: we had also seen that our usability test participants were more likely to click on Computing (above the fold) than on Information Technology (below the fold).
We looked at the content of these two subjects and discovered that visitors should really think about both of them before choosing either. The interface, however, did not present them in a way that encouraged this comparison. Indeed, some visitors might not understand the difference between these two subjects, as taught at the Open University.
We also see from Figure 3 that there are clusters of related subjects. For example, visits to Education or Teacher Training were unlikely to also include visits to Computing or Information Technology.
From this type of analysis, across the entire list of subjects, we recommended a new design with a much shorter list of subject areas based on actual user behaviour, and the clusters of subjects they tended to view together. We were also able to use this analysis to recommend a user-centered view of the subjects, rather than one that simply reflected the internal structure of the university.
One of the most startling findings was in the Psychology subject. From the point of view of the organisation of the university, Psychology is a Department within the Social Sciences faculty and should properly be listed under Social Sciences. We found that Psychology was one of the most popular subjects to visit. We also examined the search logs and found that Psychology was consistently amongst the popular search terms. We recommended that Psychology should be listed on its own as a subject. The University chose to back the user-centred approach and continues to list Psychology separately from Social Sciences.
Once a new list of subjects was designed, we ran usability tests to determine whether they improved the ability of visitors to find the subject that best matched their goals for study at the OU. These usability tests allowed us to continue to test and refine the list of subjects, adding a deeper understanding of how visitors were interpreting the terminology we chose. For example, our initial analysis showed that visitors tended to group ‘Criminology’ with ‘Law’, so we grouped them together. Usability testing showed that participants interpreted this as implying that the two subjects were closely related, whereas in fact Criminology as taught at the Open University is about the sociology of crime.
Drawing on data from web analytics and search logs to inform our choices of what to measure in summative testing
We wanted to establish a baseline measurement of the usability of the prospectus before a major new release. The choice of technique seemed obvious: conduct summative usability testing, asking representative users to attempt an appropriate range of tasks.
What tasks should be measured?
Broadly, the online prospectus has to support the user task “Find out if study at the Open University will allow me to meet my educational goals, and if so sign up”. This task is a complex one.
- A mixture of sub-tasks: Users have a variety of levels of understanding of their own needs, ranging from a vague concept like “I want to work with children and I think some studying at a university will help me to get there” through to highly specific tasks such as “I want to register on M248 Analysing Data”. Table 1 illustrates the range of goals expressed by participants in one of our usability tests.
- No clear time pattern: It is unusual for a user to sign up for a long programme of study based on a single visit to the website. Enquirers may take years to make up their minds to sign up.
- A mixture of online and offline activity: The University regards it as a success for the website if the user opts to order a paper prospectus, telephones to discuss options in more detail, or elects to attend a face-to-face course choice event. We find this mirrors the needs expressed by participants in usability studies.
- A variety of end points: Clearly, a desire to register for a specific course has an end point of achieving registration, but the less clearly articulated tasks may have many different end points – or none.
- A mixture of entry points: Users may arrive from the Open University home page, from search, or from many other areas of the University’s web presence (it has over 2000 websites) such as the BBC/Open University website associated with its popular television programmes.
- A wide range of options: Most universities in the UK offer named degrees with a relatively fixed programme of study: A student might sign up for French, say, and then study only French for three years. The Open University model is much more like a typical USA programme: over 600 courses in different subjects that can be put together in various ways to make up over 200 qualifications, each with its own rules.
- A wide range of levels: As its name implies, the “Open” University offers many starting points that have no entry requirements; other courses are restricted to those with degrees; some are aimed at people with specific prior experience or working in particular types of employments; some are advanced courses aimed at graduates who will go onto PhD studies.
Clearly this is a complex task, so we looked to the literature for the related domain of complexity in software. One of Mirel’s suggestions on this point is to “Describe the task landscapes that users construct for their patterns of inquiry and subgoals” [7]. In terms of measurement, we interpret this as breaking the complex task into smaller tasks that relate to the whole. Two obvious ones were:
- Order a print prospectus: a defined success point
- Extract simple information from a course description: a basic sub-task that contributes to users’ overall decisions.
These two hardly seemed enough to capture the richness of the full task. But many of the other tasks were highly specific, relying on an interest in a particular subject area. The challenge we faced was how to select tasks that were both appropriate for measurement, but also created an overall picture that could stand as a proxy for the richness of the full task.
Tasks extracted from search log analysis
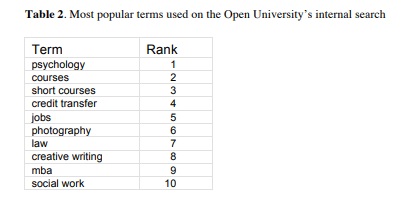
When we examine our search logs, we find that subjects, courses and specific jobs dominate, as can be seen from the list of top search terms in Table 2 below. As is usual with search analysis, we find that the top few search terms are strongly indicative of the searches in general [8].
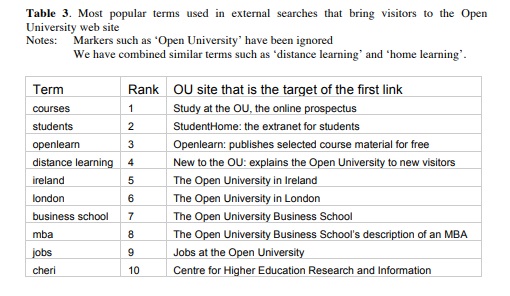
We also found that external search (search terms entered in Google) is dominated by terms such as ‘open university’, which we interpret as markers of the visitor’s intention of getting to the Open University website specifically [8]. Stripping out those markers, we found that search will bring visitors to many different entry points in the web presence, as shown in table 3.
Using web traffic analysis as a source of tasks
Our next source of data was the traffic analysis. We wanted to find out whether the users tended to stay on their arrival point within the University’s web presence, or whether they tended to move across to the part of the website that we particularly wanted to measure: the prospectus, Study at the OU.
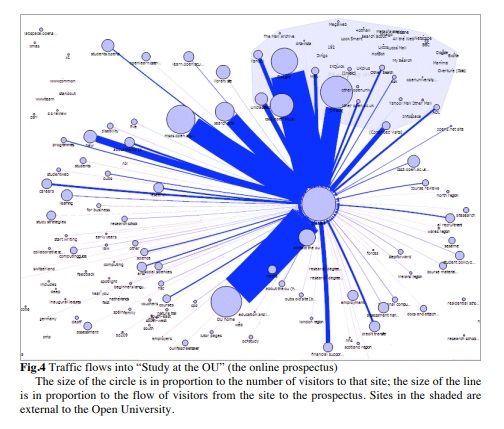
Figure 4 illustrates traffic flows into the “Study at the OU” prospectus sub-site from external sites (shaded area) and other parts of the OU’s web presence. We found that the two biggest flows of traffic into “Study at the OU” are from Google and from the Open University’s home page, as we expected. But we also found important flows from many other websites within the overall OU web presence, and we found that a wide range of websites had some flow. Broadly, any visitor to the OU’s web presence was likely to end up on the prospectus at some point during their visit.
This added a third element to our mixture of tasks:
- Visitors to many of the OU’s web sites end up on the prospectus.
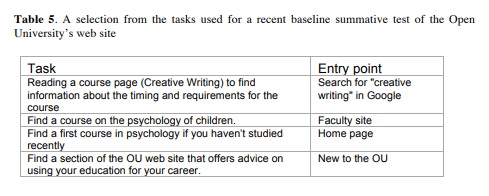
The set of tasks used for our measurement
The final set of tasks reflected all of these considerations:
- Different user goals
- The relative popularity of different subjects
- A range of different entry points
By using the site and search analytics to construct the tasks we could be confident that the summative test would reflect typical behavior. It also meant that the tasks were relevant to many of the participants, making their behaviour more realistic.
Using search logs to establish whether a new feature is important for usability
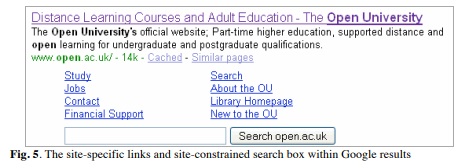
A third way we use measurement is to establish whether something is important enough to require further attention. For example, Google is a crucial source of traffic for this site, as for so many others. For some time, Google provided a set of site-specific links as part of the results for selected sites. In 2008, Google introduced a new feature into its results for selected large domains: a site-constrained search box (figure 5, below).
We wanted to know whether this box had affected user behaviour. Were visitors using it? Did we need to think about exploring it in our next round of usability testing?
Use of the ‘site’ box is negligible
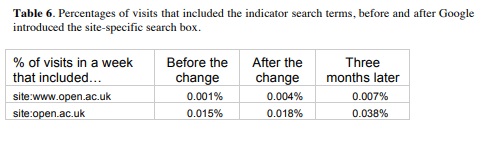
The site-constrained box has the same effect as using the Google ‘site:’ feature in their advanced search: it performs a Google search, restricted to a particular domain. In March, these searches were referred with ‘site:www.open.ac.uk’ appended to the search term. By July, Google was referring them with ‘site:open.ac.uk’ appended.
We therefore analysed search logs from three different weeks: before Google introduced the search box, immediately after, and some months later. We looked for search terms that included the indicator terms “site:www.open.ac.uk” or “site:open.ac.uk”.
The analysis showed that use of the site-constrained search box was a negligible proportion of total visits, well under a tenth of a percent (fewer than one in a thousand), and that we could safely ignore the feature for the moment.
Conclusion
Unsurprisingly, our conclusion is that we get the best insights when we combine data from whatever sources we can lay our hands on, and we continue to iterate between different approaches according to what we find and the questions that we want to answer. And it can be just as valuable to find out what we can safely ignore.
References
- Jarrett, C, Quesenbery, W., Roddis, I.: Applying Usability Principles to Content for Diverse Audiences. In: Proceedings of HCI 2006 volume 2, pp98-102 (2006)
- Jarrett, C., Roddis, I.: How to Obtain Maximum Insight by Cross-Referring Site Statistics, Focus Groups and Usability Techniques. Presentation at Web Based Surveys and Usability Testing, Institute for International Research, San Francisco, CA (2002)
- Nielsen, J., Landauer, T. K.: A Mathematical Model of the Finding of Usability Problems. In: Proceedings of the SIGCHI Conference on Human factors in Computing Systems, pp.206–213, ACM, Amsterdam, The Netherlands (1993)
- Spool, J., Schroeder, W.: Testing Web Sites: Five Users is Nowhere Near Enough. In: Proceedings of CHI 2001 p.p. 285–286, ACM, Seattle, Washington (2001)
- Lewis, J. R.: Sample Sizes for Usability Tests: Mostly Math, not Magic. In: Interactions. 13 (6), pp. 29–33 (2006).
- Lewis, J. R.: Usability testing In: Salvendy, G. Handbook of Human Factors and Ergonomics, p. 1278 and p. 1289. John Wiley and Sons, Hoboken, NJ. (2006)
- Mirel, B.: Interaction Design for Complex Problem Solving: Developing Useful and Usable Software, p. 95. Morgan Kaufmann, San Francisco, CA (2003)
- Quesenbery, W., Jarrett, C., Roddis, I., Allen, S., Stirling, V.: Search Is Now Normal Behavior. What Do We Do About That? In: Proceedings of the Usability Professionals’ Association Conference (electronic proceedings) (2008)