My topic for 2025 was ‘error rates and data quality’, and it was a pleasure to run a workshop at the 2025 Service Design in Government conference. Sharon Dale worked with me on making some changes from the previous version, and it was disappointing for both of us that she wasn’t able to be at the conference due to a family emergency.
Our title was “Garbage in, garbage out? Measuring error rates and data quality to get ready for AI”, and our overall aim was to get people interested in errors and provoke some good conversations.
I was also happy to repeat a version of the workshop at Virtual SDinGOV conference in March 2026.
There’s an overview of all the workshops and activities in this post: How to think about error rates and data quality as we head into AI
Attendees shared stories of ‘fudging’ forms
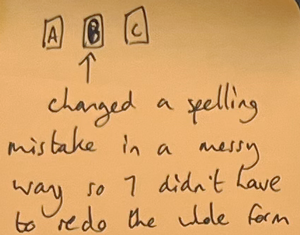 We opened by thinking about occasions on which we had been less than truthful on a form. Reviewing them later, I was struck about how much I related to many of them, including:
- changed a spelling mistake in a really messy way so I didn’t have to redo the whole form
- car insurance – job title wasn’t on the list so picked a different one
- filling in an NHS form for past (bad) symptoms not the current (ok) ones
- filled my inactive mobile number to avoid ads.
Overall, the reasons seem to me to be a mixture of:
- being forced into an error because of an inadequate set of options
- portraying a different or better version of ourselves
- protecting our privacy
- and possibly some other aspects that I need to think through.
We thought about errors in the services we work on

We then swapped to thinking about errors in services, working through a series of exercises that seemed to get more challenging as we went along.
- Write on a sticky note a brief description of:
- a service that your team is responsible for
- an example of something that you consider as an error in that service
- Compare your stickies with your neighbour. Do you have similar or different errors?
- Try allocating your errors to a chart with seven areas for different types of errors, plus a spare:
- Problems along the way
- Wrong result
- Unnecessary action
- Delayed-impact problem
- Non-uptake / over-uptake
- Technology problem
- Something else?
- If you know the error rate for any of the errors, add a star.
- An error rate has a number of errors divided by something. For the service you are thinking about, what would you divide by?
- Some of the errors do not have a star for a known error rate. Any ideas for changing that, maybe by doing some measuring?
We got one example of monitoring all the types of errors
One team managed to find an error for each of the seven types, and knew the error rates for all of them. These all relate to ‘Apply for Carer’s Allowance’ which was one of the first UK Government services to be part of the new GOV.UK website, and went fully live in 2016. Since then, the Department for Work and Pensions (DWP) has continued to monitor and use data to improve the service, so I was glad some folks from DWP were at the workshop to give us this example.
- Carer’s allowance: Make a claim – live service on GOV.UK
- A live service is not the end of the story – DWP Digital, 2016
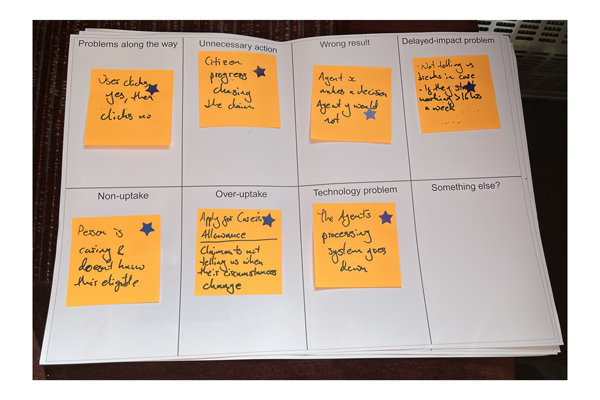
| Error | Example from ‘Apply for carer’s allowance’ |
|---|---|
| Problems along the way | User clicks yes, then clicks no |
| Unnecessary action | Citizen progress chasing the claim |
| Wrong result | Agent x makes a decision agent y would not |
| Delayed-impact problem | – Not telling us breaks in care – If they start working > 16hrs a week |
| Non-uptake | Person is caring and doesn’t know eligible |
| Over-uptake | Claimant not telling us when their circumstances change |
| Technology problem | The agent’s processing system goes down |
Most of us have a less comprehensive view
At the beginning of the workshop, I admitted that I had not give much thought to measuring error rates for many years until a post from Martin Jordan on BlueSky reignited my interest. I think it’s fair to say that generally, most attendees at the workshop leaned more toward my ‘hmm, better start thinking about errors’ level than towards the DWP team’s extra-organised and thorough approach.
In exercise 4, I asked attendees to put a star on any error where they knew the error rates. When reviewing the stickies later I made two piles of those with and without stars. I think you can see from the picture below that ones where we don’t know the error rates outnumbered by ones where we do by about 4 to 1.

Errors can overlap
Although many of the errors identified fitted into one of the error categories, it’s also true that sometimes an error can overlap. As one person put it in the final EasyRetro:
“I found there was so much overlap between the error framework categories, depending when you look at in the journey”.
Thinking about this later, I realised that this will often happen. For example, someone might make a wrong choice in a ‘problem along the way’ that later leads to a wrong outcome, which could cause unnecessary action from that person in correcting the problem and might eventually lead to a delayed-impact problem as the wrong outcome gets recorded and misused later.
Nevertheless, it seemed to me that most attendees found some value in considering the different categories of errors and where they might arise in their service. And I wondered about running a variation on this workshop where teams start with an error in one of the categories and then look to see what the consequences might be for other categories.
Attendees contributed final thoughts
The workshop finished with a brief look at the Data Quality Framework, and a chance to share our final thoughts and reflections in an EasyRetro. The EasyRetro is no longer available but I collected the comments in this document:
I was delighted that several people decided that their next steps might include investigating errors, measuring error rates, or similar. For example:
Measure and learn from error rates more frequently”
(‘Next step’ thought from a workshop attendee)
Thanks for all the contributions
This was my final workshop for my 2025 topic, error rates and data quality. I’m grateful for all the ideas and effort that people have contributed, and pleased that this workshop achieved my overall aim of getting people started on some good conversations about data quality and error rates, as many of us contempate directives to include AI in our work.
- Overview: How to think about error rates and data quality as we head into AI
- Six categories of errors: How to think about errors in services
If you would like me to run a similar workshop for your organisation, please contact me. Or feel welcome to use the slides yourself – they are Creative Commons licensed.
Here are the workshop materials:
-
- Error categories chart (pdf) created by Sharon Dale
- Garbage in, garbage out – workshop at SDinGOV 2025 (slides as pdf)
- View slides below or download from SlideShare