
My theory is that to get the best out of any AI, it helps to start with good quality data. So my 2025 topic is error rates and data quality. In June 2025, I had a chance to get some practical input from attendees at UX Connect in Aarhus, Denmark.
I’d like to thank everyone who contributed for:
- confirming some previous findings (mostly, we know some things about errors but are not monitoring error rates very much)
- challenging my thinking about the topic (such as: what about the mistakes we make in our own work as user-centred design practitioners?).
The UX Connect conference is small, focused, and diverse
UX Connect is one of the conferences marketed by Boye & Co., who focus on helping people to connect and create professional networks.
The conference is curated by Jens Hofman Hansen from Vertica, and is held on the top floor of Vertica’s office in a historic bank building. We all appreciated the convenient location and delicious vegetarian food.
It’s small. About 35 of us met mostly in one room, with one track, and the programme gave us lots of opportunities to chat.
It’s focused. In my workshop, I asked attendees to write a sticky note saying what sort of work they do. Nearly everyone mentioned ‘design’, more than half mentioned ‘UX’, and many of the others mentioned ‘digital’. And although there was no specific theme, it was noticeable that many of the sessions (including my own) mentioned AI in some way or another.

It’s diverse. The products and areas attendees work in were wide ranging. For example, just from the sessions:
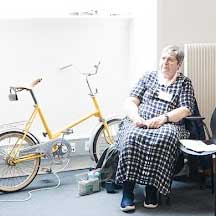
- Natalia Bourges described improving the user experience of setting up, riding, and travelling with professional and semi-pro bicycles.
- Anja Saabye took us through some of the challenges of design systems for robot arms used in industrial settings.
- Jens, our curator, riffed on designing the user experience of jazz bars.
And, while nearly all the attendees now live in Denmark or Germany, we came from a variety of ethnic origins and backgrounds. For example, I asked attendees to note ‘what brought them to their work’ and the answers included:
- photography
- my mom’s ad agency
- fashion
- market analysis.
Our diversity of perspectives and types of work really added to the experience of the conference, and was exactly what I was hoping for in my own workshop.
I asked attendees about “fudging” in forms
Many of us felt able to reveal an occasion when we had “fudged” a form – we had provided an answer that was less than truthful. The most common areas mentioned by attendees on their sticky notes were:
- age
- email address
- phone number
- nationality.
Some people also mentioned their reasons for fudging forms, for example:
- just want to finish the form
- forced to choose an answer because it is a mandatory field, but none of the options is accurate
- when I don’t need the company to know about my personal data
- fake persona I use regularly if I don’t want to give my personal info
- over or under-rating to manipulate a rating system.
We thought about ‘an error’
I asked people to write on a sticky note:
- a brief description of a service or product related to your work
- what you consider as an error in that service or product
- whether you know or don’t know the error rates.
Broadly speaking, the attendees at Aarhus provided examples that fitted quite well into the ways to think about errors that I have developed with the help of folks in previous sessions. It was useful to validate those ideas.
We make mistakes in the work that we do as practitioners
The attendees also challenged my concept of ‘an error’. Examining the sticky notes later, I realised that my phrase “a service or product related to your work” is interestingly ambiguous. It could mean:
- The product or service that we deliver to our customers, citizens, colleagues, students, or whoever it is intended for – I’ll call this ‘product or service’ for short.
- The work that we do within our organisations to help to create that product or service – I’ll call this ‘our work’ for short.
For example, these two remarks on sticky notes reflect the two meanings:
- People need to order five books but the form only allows you to order one book so people fill out five forms (product or service).
- Test subjects aimed to complete test fast rather than reflected (our work).
So far, I have not been including errors in our work as practitioners. On the whole, I’m leaning towards continuing to exclude them from my definition of my topic but it’s always illuminating to be made aware of boundaries and ambiguity.
Most of us are not calculating error rates
In previous workshops, I’ve found that many of us are not collecting error rates or completion rates. This was reflected in the conversations at this workshop, and also in the few examples provided in the sticky notes. I only got three examples of overall measurement:
- people who didn’t complete the publication / people who complete the publication (a completion rate calculation, in the context of providing a content management system)
- how many people had a wayfinding error compared to the number of people at the conference (an error rate calculation in context of running a conference)
- needs to reflect the passes, average grades and number of dropouts (a completion rate and error rate calculation in the context teaching a topic to university students).
I got only two sticky notes reflecting on how to calculate an error rate:
- number of people who faced the error / total number of users
- unique errors (per person) compared to all errors.
Attendees shared many useful takeaways
Towards the end of the workshop, I asked attendees to abandon my beloved sticky notes. We switched technologies to an EasyRetro to collect their tips, ideas, and next steps. We had a short and informal voting process.
The most popular suggestions for “Current practice: Share your best practice, tip, or suggestion for others to try” were:
- Don’t trust the data from analytics, read it as guidance (13 likes)
- Bring in people with a different perspective – they might see errors you have overlooked (12 likes)
- Question everything (9 likes)
- Revisit your old ideas from time to time (9 likes).
The most popular suggestions for “Anything that you yourself plan to find out or to do differently ” were:
- Make a checklist for error scenarios (6 likes)
- Question: What is really behind the data we are looking at. What are the possible errors in the data and how could we work with that? (2 likes)
- Always assuming that I am missing an option the user needs (2 likes)
- Always design for the worst case scenario (2 likes).
In the final category, “Any other observations or thoughts you’d like to share”, my personal favourite also resonated with some others:
- Data collection is hard (3 likes).
I also really enjoyed a couple of contributions that help us to remember that it’s important to keep a good work/life balance:
- I am planning to figure out how to do a hand stand
- Take things less seriously.
Something else might resonate with you, so you can read all the entries in this document:
- Tips and suggestions from UX Connect 25 (Google doc)
My personal takeaway was that sharing is valuable
I hoped that:
- Attendees would enjoy discussing my suggested topics, and
- I had allowed plenty of time for those chats in my workshop.
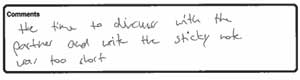
From the comments after the conference, I discovered that I was right about attendees enjoying their discussions, but wrong about ‘plenty of time for the chats’.
I’m pleased that my slides included the takeway “AI may help to start useful conversations about error rates and data quality”. I definitely learned from this workshop and I’m really glad that I went to it.