Spiegelhalter tweet

Infographic from the Journal of American Medicine. The central graph tracks cumulative mortality against time, and shows that the Lactate group had higher cumulative mortality than the Peripheral perfusion group at all times after day 3. The headline figures for all-cause mortality at 28 days are: Peripheral perfusion group 34.9% (74 patients died), Lactate group 43.4% (92 patients died). The caption below the graph reads “No significant risk difference between groups: -8.5% (95% CI, -18.2% to 1.2%).”

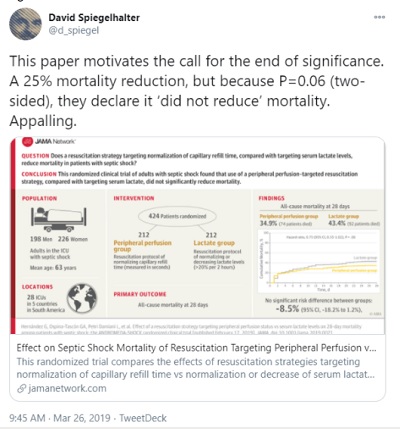
“This paper motivates the call for the end of significance. A 25% mortality reduction, but because P=0.06 (two-sided), they declare it ‘did not reduce’ mortality. Appalling.”

Courtesy of https://twitter.com/d_spiegel/status/1110477993317679104